
- October 19, 2020
- Universität für Bodenkultur Wien
- Blog
- No Comments


From big tape to big data: the Digital Farming Age
From big tape to big data: the Digital Farming Age
Going from big tape to big data with satellites helped us enter the ‘Digital Farming Age’. And now the COALA project benefits from this heritage.
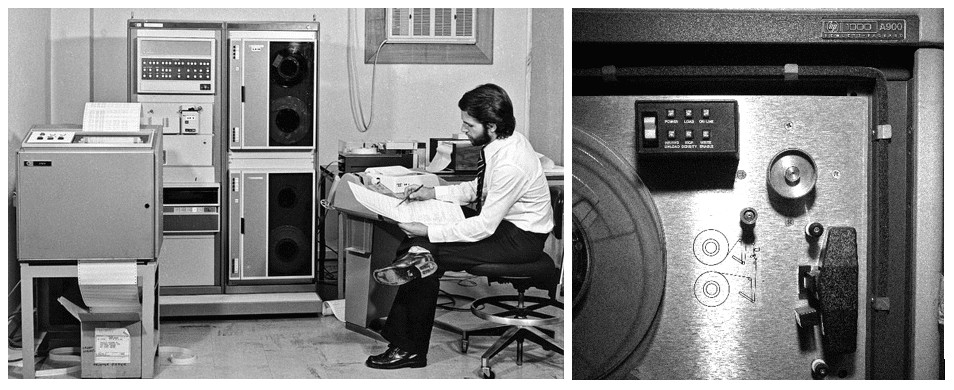
Image credit: ESO/José Francisco (josefrancisco.org) and Francesco Vuolo (Institute of Geomatics, BOKU)
The beginning of satellite images of Earth’s land surface
The systematic acquisition of satellite images of land surface started in 1972 with the U.S. Landsat program. With this data-stream, it was finally possible to monitor and the study soils and vegetation. However, these videotape recorders had limited onboard storage capacity. Images could only be collected and downlinked when the satellites were near ground receiving stations (initially only in U.S. territory). This enormously limited spatial coverage. Starting from 1975, other countries had access to the technology to communicate with the Landsat mission satellites. Now they could autonomously collect data acquired over their respective regions. This allowed a broader land coverage, but it also scattered the data over different archives. Since 2010, the Landsat Global Archive Consolidation started to bring together one global collection. The process is ongoing, and more than 5 million Landsat scenes spanning 50 years have been reconciled and made available.
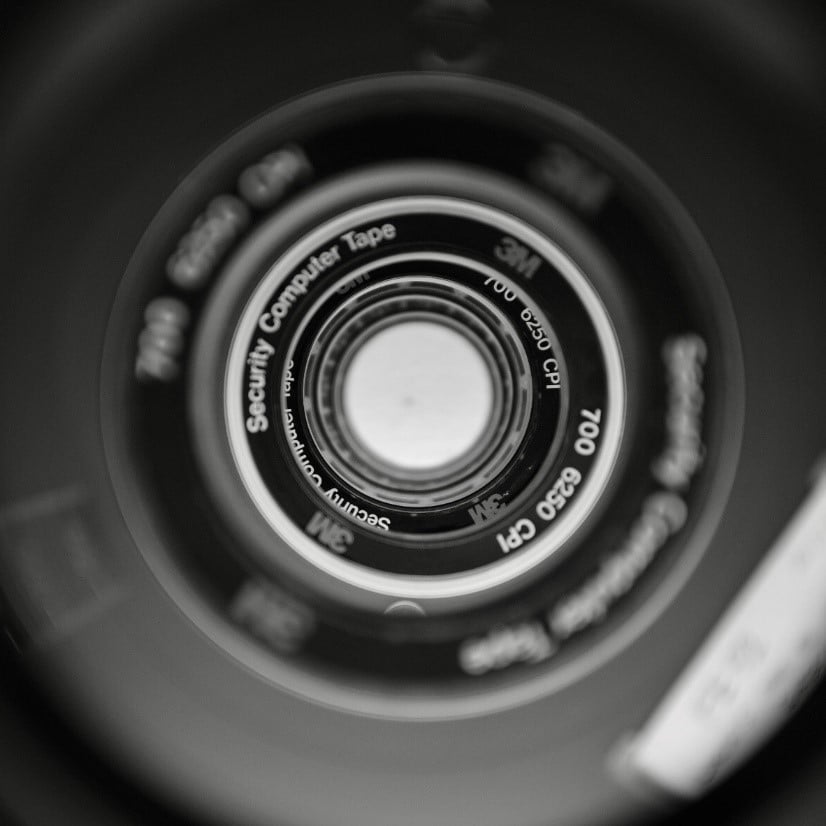
Wide magnetic tapes: 9 track tape (12.7 mm), 6250 CPI density could store up to 175MB on a standard 730 m long tape.
In January 2003, I was working at my Master´s Thesis in Agricultural Science and Technologies in Naples. My task was to analyse satellite image data to study the irrigation water use in orange orchards in Sicily. The Landsat receiving stations for my region were operated by the European Space Agency (ESA) and were located in Fucino and Matera in Italy and Kiruna in Sweden.
To request new image data we had to submit an order to ESA. Then, we would receive a CD-ROM with the image files some weeks later. The day the CD-ROM arrived at our laboratory, it was an exciting moment. I opened the parcel, took the CD-ROM and loaded the raw image files to inspect the quality and information content. Then I started the actual pre-processing and interpretation. I was a student assistant, and those galvanizing early experiences gave a clear direction to my future carrier pathway as a remote sensing scientist today.
The internet age
Sometime later, the data were delivered via FTP over the Internet. We could download the image files a few days after the satellite acquisitions and create new information content nearly in real-time. At the end of 2003, one of the concluding remarks of my Master´s Thesis was that “remote sensing from the satellite was a technology mature enough to provide operational services for water management”. We were already discussing possibilities to use the results of our data analysis to support water managers and farmers in their decision-making process. I was very impatient, and I wanted this to happen soon.
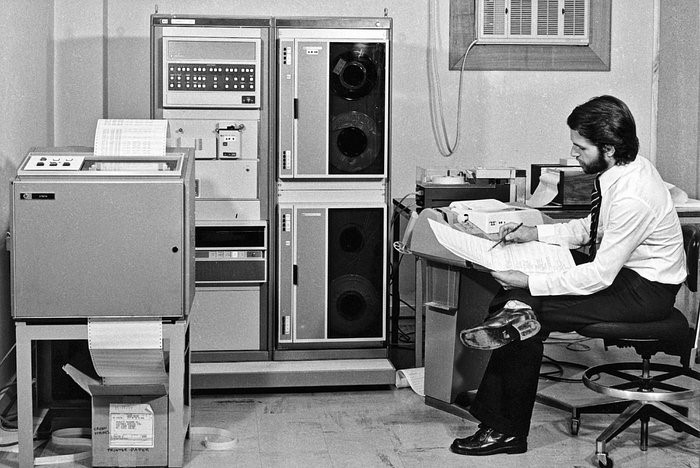
The technological gap was closing, but it was still too big for applications. My supervisor reminded me of his experience. Just 10 years earlier, with Internet and Web technologies in their infancy (e.g. no data preview was available) ordering was based on the ephemeris of Landsat, actual cloud cover was a “last-minute surprise” before ordering the image. Once received the big magnetic tapes, he had to travel to a specialised computer centre to read data, and expensive printing equipment was necessary to print and visualize a colour composite image.
In 2005 we were using one of the first 3G smartphones – the NOKIA 6633. We developed a processing chain that would generate a graphical report and text data that we were “shipping” to farmers via MMS and SMS weekly. Their feedback was instrumental, and it helped us to move forward in the development process.
Since then, the availability of operational services that provide satellite-based information to support farmers has grown extensively. And I am proud of having been part of this small transformation in the Digital Age.
Paradigm shifts in data access: from big tape to big data
I recognise at least three main paradigm shifts that made this possible. First, the availability of free and open-access satellite data starting from 2008. With the opening of the Landsat data archive, the data use has increased 20-fold (ref 1) and with it the development and availability of open-source software solutions. Secondly, the evolution of the Internet and of information technologies that made exploring and accessing data archives possible. Finally, the advent of the Sentinels, defined the “game-changer”, the constellation of satellites of the European Commission’s Copernicus programme. A totally new concept in image data quality, in the frequency of acquisition and in the availability of toolsets that allows the community to focus on harnessing information rather than accessing data and pre-processing.
Big data
With most of the Sentinel satellites in operation, the volume of fresh image data acquired every day is growing at an impressive rate. For example, the optical Sentinel-2 mission alone brings over 4 Terabytes of new products every day. Fast Internet connectivity is not sufficient anymore to download the data and process them locally. In late 2015, satellites were giving us more information than we could actually collect at our laboratory and analyse. In less than 50 years we truly went from big tape to big data. A new shift was necessary, and we moved to cloud processing.
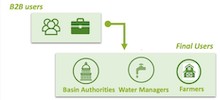
We brought our algorithms to the data with the development of the first data service platform for obtaining Sentinel-2 value-added products, specifically designed to monitor vegetation. This platform is running on the Earth Observation Data Center (EODC). The EODC was funded in 2016 by several Austrian institutions and private companies. It is fully dedicated and specialized in harvesting, archiving and maintaining Big Data. Building on this, we created other datasets and services exploited in other projects. An example is LANDSUPPORT for land management in the European policy context or COALA for irrigation and fertilizer management in Australia.
We have been in this digital revolution over the last 18 years, going from big tape to big data. And, we have contributed to creating several new concepts and innovative products. The term ‘digital farming‘ is now in our daily vocabulary, and there is a great deal of activity going on. We hope that farmers will benefit from the use of satellite technology for the management of their fields as much as they do with maps and GPS technologies on their smartphones. Therefore, I am positive, and I am really looking forward to this revolution to reach the final users.
German
Die systematische Erfassung der Erdoberfläche durch Satellitenbilder begann 1972 mit dem US-amerikanischen Landsat-Programm. Mit diesen Daten war es endlich möglich, Boden und Vegetation kontinuierlich zu überwachen und zu untersuchen. Mit der begrenzten Speicherkapazität an Bord (unter der Verwendung von Videorekordern) konnten die Bilder jedoch erst dann gesammelt und heruntergeladen werden, wenn die Satelliten in Sichtweite der Bodenempfangsstationen waren. Diese befanden sich zunächst nur auf dem Gebiet der USA, was die räumliche Abdeckung und die Zugänglichkeit der Daten enorm einschränkte. Ab 1975 war es dann auch anderen Ländern möglich, Zugang zu den Daten zu erhalten und sie konnten autonom Informationen über ihre jeweilige Region sammeln. Dies ermöglichte einerseits eine größere räumliche Nutzung der Satellitenbilder, andererseits verursachte diese nationale Herangehensweise eine Zerstreuung der Daten über zahlreiche Archive. Erst 2010 begann die Landsat Global Archive Consolidation damit, so viele Szenen wie möglich in einer globalen Sammlung zusammenzufassen. Dieser Prozess ist noch nicht abgeschlossen. Immer noch werden die mehr als 5 Millionen Landsat-Aufnahmen, die in den letzten 50 Jahren entstanden, gesammelt und auf einer Plattform zur Verfügung gestellt.
Mein persönlicher Zugang zu diesem Datenschatz begann im Januar 2003, als ich an meiner Masterarbeit arbeitete, um das Universitätsstudium der Agrarwissenschaften und -technologien in Neapel abzuschließen. Meine Aufgabe bestand in der Analyse von Satellitenbilddaten zur Untersuchung des Wasserverbrauchs für Bewässerungsanlagen in Orangenplantagen in Sizilien. Die Landsat-Empfangsstationen für meine Region wurden von der Europäischen Weltraumorganisation (ESA) betrieben und befanden sich in Fucino und Matera in Italien und in Kiruna in Schweden.
Um neue Bilddaten anzufordern, mussten wir eine Bestellung bei der ESA aufgeben. Einige Wochen später erhielten wir dann eine CD-ROM mit den Bilddateien. Der Tag, an dem die CD-ROM in unserem Labor ankam, war immer ein aufregender Moment; ich öffnete das Postpaket, nahm die CD-ROM und lud die Rohbilddateien, um die Qualität und den Informationsgehalt zu prüfen. Dann begann ich mit der eigentlichen Vorverarbeitung und Interpretation. Ich war eine studentische Hilfskraft und diese aufregenden ersten Erfahrungen gaben eine klare Richtung für meinen zukünftigen wissenschaftlichen Berufsweg in der Fernerkundung vor.
Einige Zeit später wurden die Daten per FTP über das Internet geliefert. Wir konnten die Bilddateien wenige Tage nach den Satellitenaufnahmen herunterladen und fast in Echtzeit analysieren. Ende 2003 lautete eine der Schlussbemerkungen meiner Masterarbeit: “Die Fernerkundung mittels Satelliten ist eine Technologie, die geeignet ist, um operationelle Dienste für das Wassermanagement bereitzustellen”. Wir diskutierten bereits über Möglichkeiten, die Ergebnisse unserer Datenanalyse zu nutzen, um WassermanagerInnen und LandwirtInnen in ihrem Entscheidungsprozess zu unterstützen. Ich war sehr ungeduldig und hoffte auf eine baldige Umsetzung.
Die technologische Lücke schloss sich, aber sie war immer noch zu groß für praktische Anwendungen. Mein Vorgesetzter, der in den 1990er Jahren studiert hatte, erinnerte mich an seine Erfahrungen: Nur zehn Jahre zuvor, als Internet- und Web-Technologien noch in den Kinderschuhen steckten – es war z.B. keine Datenvorschau verfügbar – basierte die Bestellung auf der Position von Landsat und die tatsächliche Bewölkung war eine “Überraschung in letzter Minute” vor der Bestellung des Bildes. Sobald er die großen Magnetbänder erhalten hatte, musste er in ein spezialisiertes Rechenzentrum reisen, um die Daten auszulesen und es waren teure Drucker erforderlich, um ein farbiges Bild zu visualisieren.
Im Jahr 2005 (unter Verwendung eines der ersten 3G-Smartphones – des NOKIA 6633) entwickelten wir einen Verarbeitungsprozess, der grafische Berichts- und Textdaten generierte, die wir wöchentlich per MMS und SMS an die Landwirte verschickten. Ihr Feedback war sehr nützlich und half uns, die Entwicklung voranzutreiben.
Seitdem ist die Verfügbarkeit von operationellen Diensten, die satellitengestützte Informationen zur Unterstützung der LandwirtInnen nutzen, stark gestiegen und ich bin stolz darauf, Teil dieser kleinen Revolution im digitalen Zeitalter gewesen zu sein.
Ich erkenne mindestens drei wesentliche Paradigmenwechsel, die dies möglich gemacht haben: Erstens, die Verfügbarkeit von gratis zugänglichen Satellitendaten ab 2008. Mit der Öffnung des Landsat-Datenarchivs hat sich die Datennutzung um das 20-fache erhöht und damit die Entwicklung und Verfügbarkeit von Open-Source-Softwarelösungen. Zweitens, die Entwicklung des Internets und der Informationstechnologien, die die Erforschung von und den Zugang zu Datenarchiven ermöglicht haben. Und schließlich die Sentinel–Mission der Europäischen Kommission, die einen Game Changer in Bezug auf Qualität und Verfügbarkeit von Satellitendaten darstellt. Endlich ist es möglich, sich auf die Nutzbarkeit von Informationen, statt auf den Verfügbarkeit der Daten und die Vorverarbeitung zu konzentrieren.
Da die meisten Sentinel-Satelliten bereits in Betrieb sind, wächst das Volumen der täglich neu erfassten Bilddaten mit beeindruckender Geschwindigkeit. So liefert beispielsweise allein die optische Sentinel-2-Mission täglich über vier Terabyte an neuen Bilddaten. Schnelle Internetverbindungen reichen nicht mehr aus, um die Daten herunterzuladen und lokal zu verarbeiten. Ende des Jahres 2015 lieferten uns die Satelliten bereits mehr Informationen, als wir vor Ort mit unserer Infrastruktur sammeln und analysieren konnten. Eine neue Umstellung war notwendig, und wir gingen zum Cloud Processing über: Wir nutzten unsere Algorithmen für die Entwicklung der ersten Datenservice-Plattform für die Bereitstellung von Sentinel-2-Mehrwertprodukten, die speziell für die Überwachung von Vegetation und Biomasse entwickelt wurden. Diese Plattform läuft im Erdbeobachtungsdatenzentrum (EODC), das 2016 von mehreren österreichischen Institutionen und privaten Unternehmen, die sich voll und ganz auf das Sammeln, Archivieren und Warten von großen Daten spezialisiert haben, finanziert wurde. Darauf aufbauend haben wir weitere Datensätze und Dienste erstellt, die in anderen Projekten genutzt werden, wie z.B. in LANDSUPPORT für das Landmanagement im europäischen Kontext (https://www.landsupport.eu/) oder in COALA für das Bewässerungs- und Düngemittelmanagement in Australien (https://www.coalaproject.eu/).
Wir haben in den letzten 18 Jahren an dieser digitalen Revolution teilgenommen und zur Entwicklung einer Reihe neuer Konzepte und innovativer Produkte beigetragen. Der Begriff “Precision Farming” hält Einzug in unser tägliches Vokabular, und es sind viele Aktivitäten im Gange. Wir hoffen, dass die LandwirtInnen Satellitendaten für die Bewirtschaftung ihrer Felder ebenso selbstverständlich nutzen werden wie es bei Karten und GPS-Technologien Smartphones bereits bei der breiten Bevölkerung üblich ist. Ich bin positiv gestimmt, und ich freue mich wirklich darauf, zu erleben, wie diese digitale Revolution die EndverbraucherInnen erreicht.