[vc_row full_width=”stretch_row” shadow_x_offset=”0″ shadow_y_offset=”0″ shadow_blur=”0″ shadow_spread=”0″ shadow_color=”” css=”.vc_custom_1588233490649{margin-top: -60px !important;padding-top: 200px !important;background-image: url(https://lucar155.sg-host.com/wp-content/uploads/2020/04/Credit-Michael-Kai-0090-scaled.jpg?id=3057) !important;background-position: center !important;background-repeat: no-repeat !important;background-size: cover !important;}” el_class=”sm_mgt_0″][vc_column offset=”vc_hidden-sm vc_hidden-xs”][stm_spacer height=”240px”][/vc_column][/vc_row][vc_row shadow_x_offset=”0″ shadow_y_offset=”0″ shadow_blur=”0″ shadow_spread=”0″ shadow_color=”” el_class=”overlap”][vc_column][vc_custom_heading text=”COALA API Quick Start” font_container=”tag:h1|text_align:center” use_theme_fonts=”yes” heading_line=”no_line” heading_icon=”stmicon-smile” heading_icon_pos=”bottom” css=”.vc_custom_1675171176991{margin-bottom: 60px !important;padding-top: 40px !important;}”][/vc_column][/vc_row][vc_row][vc_column][vc_column_text css=”.vc_custom_1675173468155{margin-bottom: 60px !important;}”]This guide offers a quick access to a selection of COALA API request to obtain the COALA products. An example package is prepared as a Postman software collection.

The guide includes the following steps:

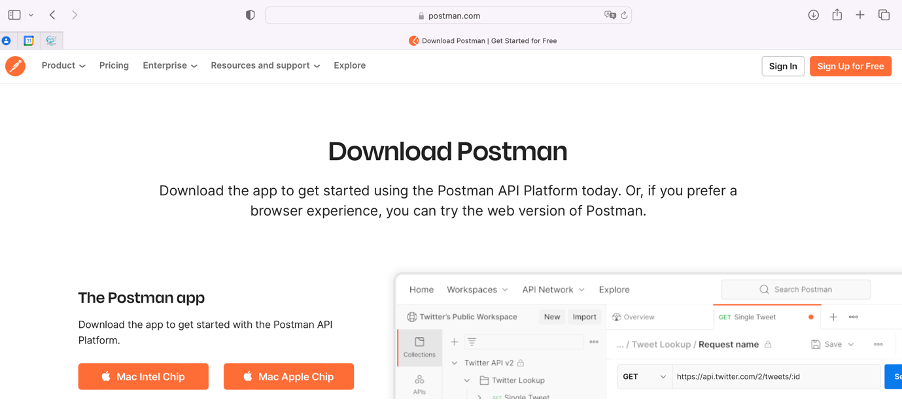
  • Download and install Postman API platform (free software)
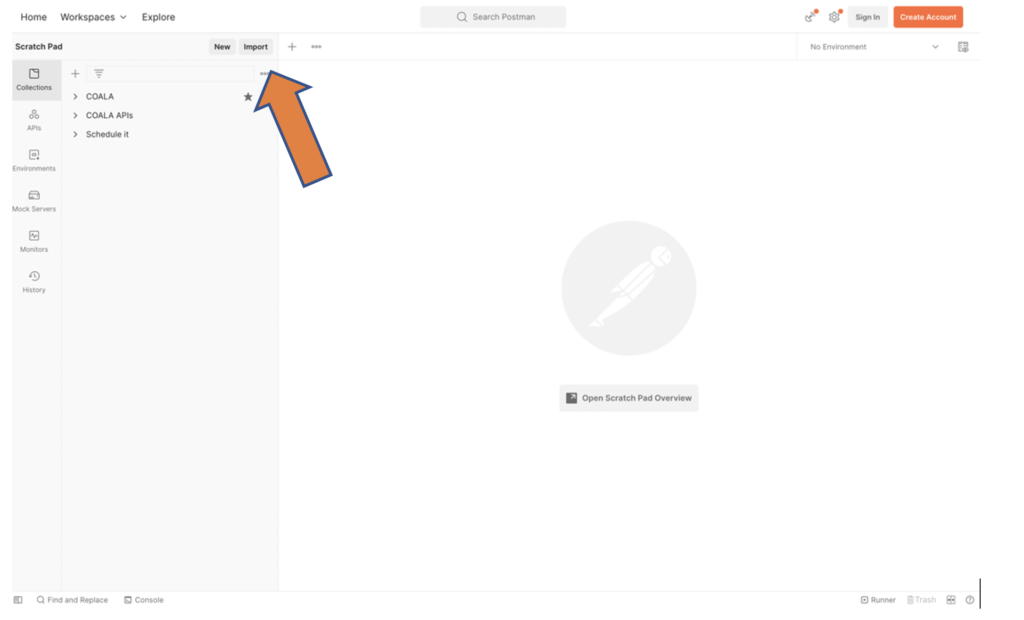
  • Download the COALA Postman „Collection“ of example queries 
  • Import the collection in Postman
  • Test a simple query and explore the results 
[/vc_column_text][/vc_column][/vc_row][vc_row shadow_x_offset=”0″ shadow_y_offset=”0″ shadow_blur=”0″ shadow_spread=”0″ shadow_color=”” el_class=”overlap”][vc_column][vc_custom_heading text=”Step 1. Download and Install Postman API Platform” font_container=”tag:h1|text_align:center” use_theme_fonts=”yes” heading_line=”no_line” heading_icon=”stmicon-smile” heading_icon_pos=”bottom” css=”.vc_custom_1675173756800{margin-bottom: 60px !important;padding-top: 40px !important;}”][/vc_column][/vc_row][vc_row][vc_column][stm_spacer height=”64″][/vc_column][/vc_row][vc_row css=”.vc_custom_1495627619813{margin-bottom: 50px !important;}”][vc_column][vc_column_text css=”.vc_custom_1675174892376{margin-bottom: 60px !important;}”]

Postman download (external link)

[/vc_column_text][vc_single_image image=”5266″ img_size=”full”][/vc_column][/vc_row][vc_row][vc_column][stm_spacer height=”64″][/vc_column][/vc_row][vc_row shadow_x_offset=”0″ shadow_y_offset=”0″ shadow_blur=”0″ shadow_spread=”0″ shadow_color=”” el_class=”overlap”][vc_column][vc_custom_heading text=”Step 2. Download the COALA Postman collection of example” font_container=”tag:h1|text_align:center” use_theme_fonts=”yes” heading_line=”no_line” heading_icon=”stmicon-smile” heading_icon_pos=”bottom” css=”.vc_custom_1675174216633{margin-bottom: 60px !important;padding-top: 40px !important;}”][/vc_column][/vc_row][vc_row css=”.vc_custom_1495627619813{margin-bottom: 50px !important;}”][vc_column][vc_column_text css=”.vc_custom_1675174055669{margin-bottom: 60px !important;}”] [/vc_column_text][/vc_column][/vc_row][vc_row][vc_column][stm_spacer height=”64″][/vc_column][/vc_row][vc_row shadow_x_offset=”0″ shadow_y_offset=”0″ shadow_blur=”0″ shadow_spread=”0″ shadow_color=”” el_class=”overlap”][vc_column][vc_custom_heading text=”Step 3. Import the collection in Postman” font_container=”tag:h1|text_align:center” use_theme_fonts=”yes” heading_line=”no_line” heading_icon=”stmicon-smile” heading_icon_pos=”bottom” css=”.vc_custom_1675174267598{margin-bottom: 60px !important;padding-top: 40px !important;}”][/vc_column][/vc_row][vc_row css=”.vc_custom_1495627619813{margin-bottom: 50px !important;}”][vc_column][vc_single_image image=”5272″ img_size=”full”][/vc_column][/vc_row][vc_row][vc_column][stm_spacer height=”64″][/vc_column][/vc_row][vc_row shadow_x_offset=”0″ shadow_y_offset=”0″ shadow_blur=”0″ shadow_spread=”0″ shadow_color=”” el_class=”overlap”][vc_column][vc_custom_heading text=”Step 4. Test a simple API query” font_container=”tag:h1|text_align:center” use_theme_fonts=”yes” heading_line=”no_line” heading_icon=”stmicon-smile” heading_icon_pos=”bottom” css=”.vc_custom_1675175000073{margin-bottom: 60px !important;padding-top: 40px !important;}”][/vc_column][/vc_row][vc_row css=”.vc_custom_1495627619813{margin-bottom: 50px !important;}”][vc_column][vc_column_text css=”.vc_custom_1675176048885{margin-bottom: 60px !important;}”]

After Import, the collection will appear. Double click on the first call „ROI-QuickStart“ (green arrow below).

It will open the parameters windows (yellow arrow below). Click on „Send“ (blue arrow below) and explore the response (red arrow below).


[/vc_column_text][vc_single_image image=”5278″ img_size=”full”][stm_video image=”5280″ url=”https://lucar155.sg-host.com/wp-content/uploads/2023/01/Screen-Recording-2023-01-31-at-15.58.28.mov”][/vc_column][/vc_row][vc_row][vc_column width=”1/2″][vc_column_text css=”.vc_custom_1675185309333{margin-bottom: 60px !important;}”]

The response shows the ROI for the user “coala” and the properties of these ROI.

For example, the ROI called “prova” is processing data for the last 30 days (period=30 days) and it is considering only Sentinel-2 (S2) observations with a cloud cover below 30%.

Subsequently, the S2 granules active for this region are listed. The response further show the actual geometry of the ROI.


[/vc_column_text][vc_single_image image=”5287″ img_size=”full”][/vc_column][vc_column width=”1/2″][vc_column_text css=”.vc_custom_1675185477755{margin-bottom: 60px !important;}”]

The response shows the S2 specific indicators that are active for the ROI. In this cases, Leaf Area Index (LAI) and NDVI.

In addition, NDVI is obtained with a daily temporal resolution considering a period of 90 days. Daily data are the results of an interpolation process.

[/vc_column_text][vc_single_image image=”5288″ img_size=”full” alignment=”right”][/vc_column][/vc_row][vc_row][vc_column][vc_column_text css=”.vc_custom_1675185809139{margin-bottom: 60px !important;}”]

Let’s try to query some data for a demo polygon with the following geometry (geoJSON text format):

{ “type”: “MultiPolygon”, “coordinates”: [ [ [ [ 146.036819740052692, -34.371579922914933 ], [ 146.042928273087199, -34.373860991110092 ], [ 146.045358803594723, -34.375037902153309 ], [ 146.046928458682828, -34.377365990743009 ], [ 146.047210835807022, -34.378856952593914 ], [ 146.043918229143344, -34.378913980976535 ], [ 146.043167300844942, -34.379156238728456 ], [ 146.034252707750568, -34.377969639194838 ], [ 146.034222297957001, -34.376273865678044 ], [ 146.036242759803201, -34.374056651420247 ], [ 146.036819740052692, -34.371579922914933 ] ] ] ] }


[/vc_column_text][vc_single_image image=”5297″ img_size=”full”][vc_column_text css=”.vc_custom_1675185477755{margin-bottom: 60px !important;}”]

The response shows the S2 specific indicators that are active for the ROI. In this cases, Leaf Area Index (LAI) and NDVI.

In addition, NDVI is obtained with a daily temporal resolution considering a period of 90 days. Daily data are the results of an interpolation process.

[/vc_column_text][vc_single_image image=”5288″ img_size=”full” alignment=”right”][/vc_column][/vc_row]