
- December 16, 2020
- Carlo De Michele
- Tutorial Students, Uncategorized
- No Comments
- Time raster maps visualization;
- Time series values extraction in a specific point;
- Vector layers visualization and the associated attribute table selection, visualization and filtering tools;
- Temporal statistics implementation on a raster quantity for a certain vector feature.


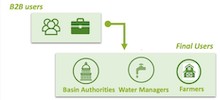


Getting started with Map Time Explorer (MTE)
Map Time Explorer is a Web tool, which has been developed to visualize and to analyze geographical datasets towards time and space. It is a Web-GIS platform that can be easily used by anyone, since it provides functions and characteristics that are typical of the most used GIS. In this way, it results in a simple tool, mostly (but not only) created for technical regional or local authorities. Moreover, Ariespace experience in domain of analysis and interpretation of time data series, allowed to design a specific device for the temporal raster series exploration.
The main system characteristics are the following:
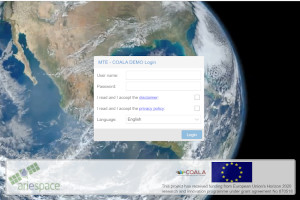
Log-in
Once you got the User Name and Password, you can access the platform.
(Do you not have the credential to access? contact us!)
Typing the URL mte.coalaproject.eu in any browser (Mozilla FireFox or google Chrome are recommended) you will be connected to the access web page and you will have to enter the Login data previously provided (User Name and Password). It is possible to choose the app language and before to actually login you will have to declare to have accepted the licence conditions and privacy policy, by clicking on the appropriate check-boxes (watch the video on the side).
User Interface
Once you are signed in, the platform will look like in next figure, in which the MTE several sections are highlighted in different colors and described as follows.
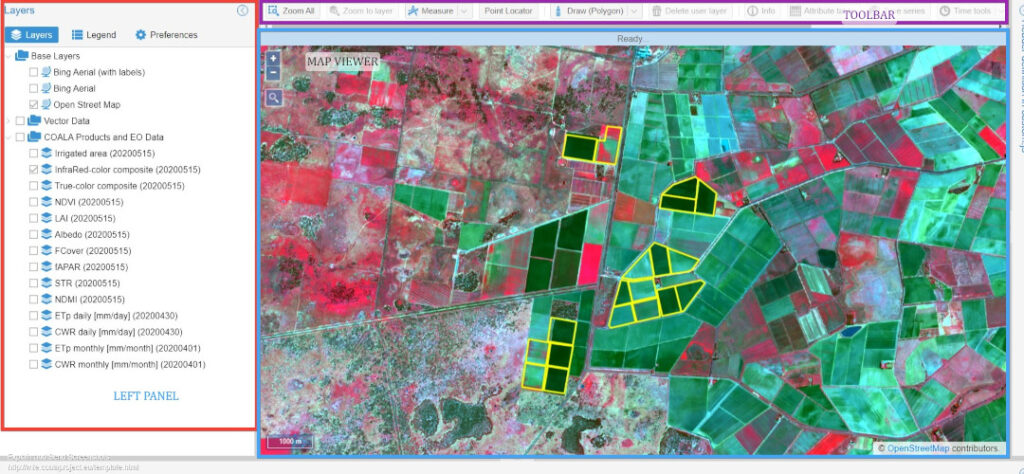
Just as the most common GIS environments, the app is organized in three main areas:
1) Mapviewer, where several rasters and vector elements are shown;
2) Left Panel, which consists of different tabs:
a) Layers, which is the Web GIS TOC (Table Of Content) where raster and vector layers are listed;
b) Legend, where the activated layers legends are shown;
c) Preferences, which is a panel where it is possible to define the main settings;
3) Toolbar, a set of tools to navigate and to explore data.
Go to mte.coalaproject.eu and try by yourself!