
- July 9, 2020
- UNSW
- Blog, Tutorial Students
- No Comments


Copernicus: a Sentinel in space teaches us about land and the environment
Copernicus: a Sentinel in space teaches us about land and the environment
Copernicus is the European Union’s Earth Observation Programme, looking at our planet and its environment. Data from space satellites can help inform us about processes here on Earth.
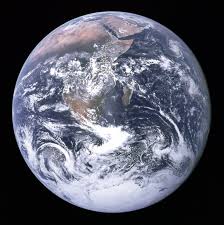
Have you ever heard the saying ‘It’s hard to see the forest for the trees?’? Sometimes a little distance is what we need. We can learn a lot about Earth by observing it from a distance. Surprisingly, we can even learn a lot about what’s going on on the surface of Earth. The great Science Communicator Carl Sagan famously spoke about Earth as a pale blue dot, coupled with this image by Voyager 1. The circle shows Voyager’s view of Earth.

Voyager 1 is currently more than 11 billion kilometres from Earth. But some satellites operate a lot closer to home. These satellites orbit the Earth, sending us data to teach us more about our home.
How can satellites teach us about Earth?
Our eyes can only see visible light. Yet, light comes in many other “colours”— infrared, ultraviolet, and gamma-ray— that can’t be seen by the naked eye. So, Satellites often ‘see’ Earth beyond visible light (blue, yellows, green, red, etc.). And, while satellites can deliver images in natural colour, they can also detect other wavelengths, like near-infrared and short-wave infrared. These satellites can also provide information about thermal bands, giving temperature data.
Copernicus is an Earth observation (EO) program that the European Union developed with the European Space Agency (ESA), the EU Member States and EU Agencies. Copernicus uses a constellation of satellites – Sentinels. Through these Sentinels, Copernicus seeks to achieve a global, continuous, high quality and extensive Earth observation. These Sentinels carry a range of technologies, such as radar and multi-spectral imaging instruments for land monitoring. While these sentinels are relatively new, the ESA launched Sentinel-2A in 2015, followed by Sentinel-2B in 2017, they can increase our understanding of processes on Earth. Significantly, they orbit the Earth at an altitude of 876 km, and with a swath width of 290 km, they cover all land surfaces, large islands, inland and coastal waters every 3-5 days.
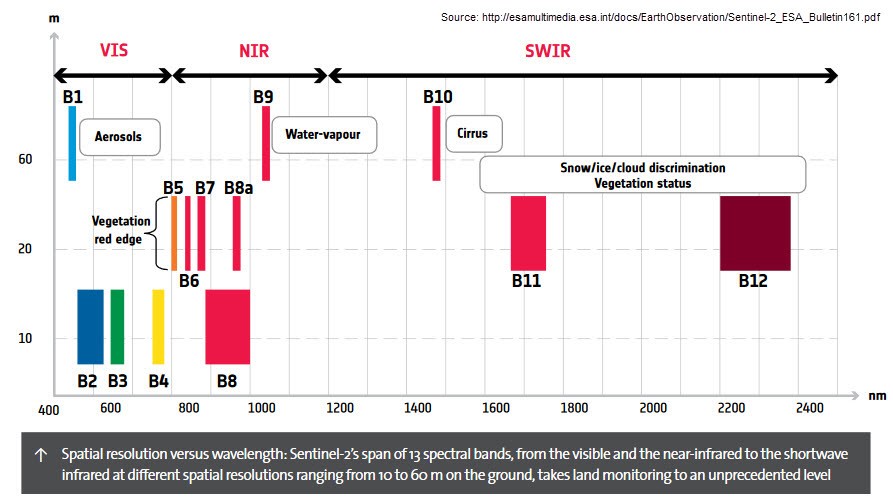
Another Sentinel feature is the high-resolution multispectral imager which can map ground objects as small as 10 x 10 metres. This high-resolution imager captures the 13 spectral bands that cover the visible and infrared regions of the light spectrum.
Visual, Infrared and more….
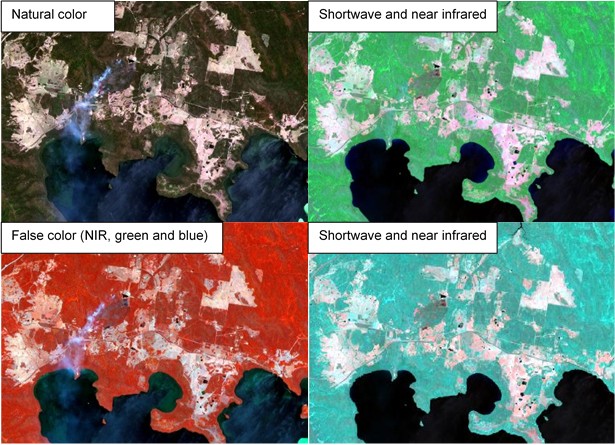
The Sentinel-2 satellites captured these images of the northern part of New South Wales during the bushfires of December 2019.
Let me take you through these images. Firstly, I’ll draw your attention to the upper left which is a natural colour (note the ‘smoke’ from the bush fire). Secondly, in the lower-left, we see the infrared vies, where the burn scar is black and the healthy vegetation appears red. Lastly, on the right, you can see Sentinel-2’s near-infrared and shortwave bands. These images show the burn scar in black and the healthy vegetation in green. The pinkish colours are paddocks and areas with dry grasses or no vegetation at all.
These kinds of views are widespread in satellite imagery. And, although the burn scar can be seen in visible light, the infrared makes it so much easier to see the difference.
Sentinels of the land and environment
The images that the Sentinels capture have a variety of uses. Take crops, for instance, these images can be used to distinguish different crop types and assess crop health. They can also monitor land-use change, track changes in seasonal water of wetlands[1] and follow the dynamics of water bodies frequently, allowing us to see significant changes[2].
Where are the cultivated areas? What areas are under irrigation? These are questions that land managers and water authorities need to answer for planning purposes. So these images are really helpful for practical purposes. As you’ve already seen they can provide a lot of information in even a glance. What else can they show us?
A case study in Colleambally
The images below are from the Sentinel-2 (20 May 2020), captured near the town of Colleambally in New South Wales.
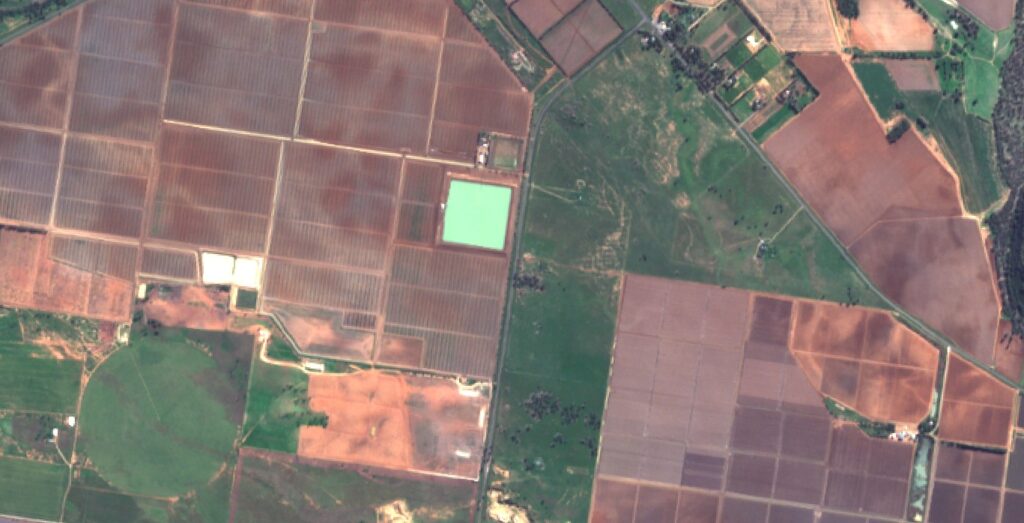
This image is a ‘natural colour composite’. The picture shows irrigated areas (e.g. the circle in the lower-left) with green vegetation in green shades, while the paddocks without vegetation have brownish shades.
Below is the same picture, this time using the near-infrared, green and blue ‘channels’ of Sentinel-2. You may notice a contrast, all the ‘green vegetation’ is now a shade of bright red colour.
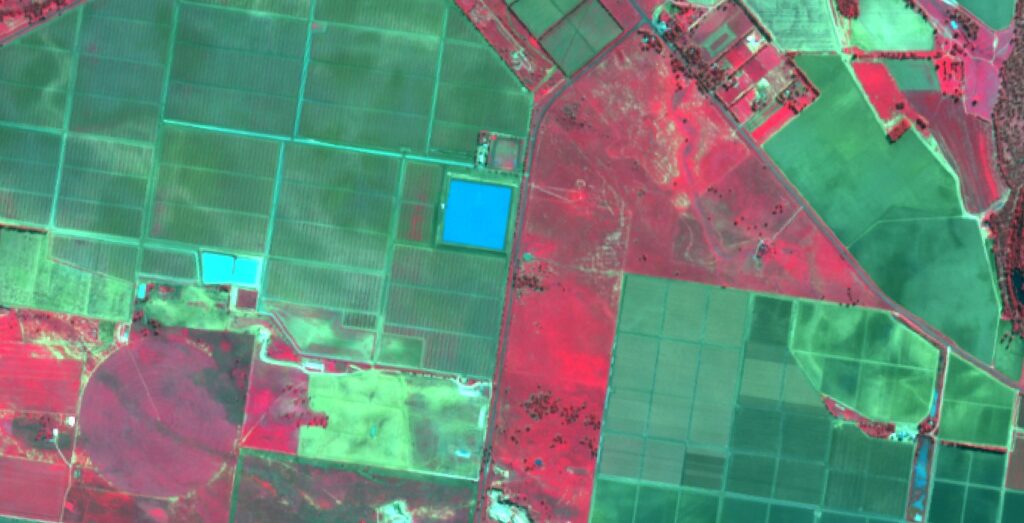
This is a popular false colour composite, where healthy vegetation appears in bright red. Ariespace, a partner of the COALA project processed these Sentinel-2 images.
It’s clear from these images that we can learn a lot from a distance. The stark difference between health vegetation and barren dirt is immediately visible, and making this data even better, the Sentinel’s come back often. They return to the same point on Earth every 3-5 days and take a new image. This is called their ‘revisiting frequency’. This revisiting frequency means that the Sentinel data is up to date and often repopulated, making their data more reliable. These datasets are then used for agricultural applications that use Earth Observation, such as Copernicus services, including the new COALA (Copernicus for sustainable agriculture in Australia) that I will introduce in my next blog.
The big picture, summarised
At first, the idea of going to space to learn more about Earth might seem strange. But, looking at these images it’s easy to see just how much information we can grasp from afar. The width, breadth and frequency of these satellite datasets lend themselves to agricultural applications. The more we can see, the more we can predict. And sometimes it’s just humbling to explore our home from up above.
By Professor Graciela Metternicht, UNSW Sydney
[1] https://sentinel.esa.int/web/sentinel/news/-/article/copernicus-sentinel-2-helps-track-changes-in-seasonal-water-of-wetlands
[2] https://sentinels.copernicus.eu/web/sentinel/news/-/article/copernicus-sentinel-2-improves-observations-of-lakes-and-water-bodies